Wave Project:
Results-
https://docs.google.com/document/d/15eg2skCBCRU5ZPMVLlKuXWMJjfLNZ7-s6D-jJZjIVME/pub
I asked people to listen to four different songs, and say what emotion they think the song has.
Introduction: I wanted to see if the key of a song affects people’s emotions. One of the reasons of the effect is that chords that are at particular frequencies make people feel differently than other frequencies (A frequency is the speed at which a wave travels).
Question: Does the key of a song affect people’s emotions? (makes people happy, sad, both, or neither).
Hypothesis: If the song is in a major key, it will convey happy emotions; if a song is in a minor key, it will convey sad emotions.
Methods and Goals: In order to do this experiment I needed to have four recorded songs without lyrics; two in a major key, and two in a minor key. I also needed to make sure that I had a way to record the answers of the eight people I tested on.
When figuring out the songs I was going to use, I needed to make sure that they all had the same rhythm, but with different chords; it was easiest for me to record my own songs, this enabled me to have complete control over what the key, rhythm, and chords.
One interesting thing I noticed is that track two is in a major key, most people said that it sounded sad, which is the opposite of my hypothesis.
Discussion: I believe that I would have had a better experiment with better data if I had time to test more people; even though I do wish I could have done this, I am happy with the results that I got.
I did this experiment because I am interested in if the key of a song affects people’s emotions; I originally thought that if the song is in a major key, people will say it is happier, and if it is in a minor key, people will say it is sadder. The results I got said that one of the songs in a major key was predominately happy, and the other was predominately sad. I found this very interesting, that although they are both in major keys people thought one of them was happy and one was sad. One of the songs in a minor key was equally happy and both happy and sad, and the other was mostly sad; the results for the songs in minor keys was definitely more predictable.
Abstract: I wanted to see if my thoughts were correct on if the key of a song affects people’s emotions. I originally thought that if the song is in a major key, it is happier, and if it is in a minor key, it is sadder. Most of my results reinforced my hypothesis, but people said that one of the songs in a major key had a sad emotion. I found this very interesting because I thought they the results would mostly say what I originally thought this experiminent would show. If I had more time and people to test, I think I would have more accurate data.
Design it Clean:
We were told to create a water filter to help a particular situation. The situation my group was given was the water quality issue in Nova Scotia, Canada.
Snow Science:
Project Reflection:
Snow science is relevant to my life because snowfall has a major impact on the water supplies. If there continues to be less snowfall a big part of water supplies for the west will be impacted. The snowmelt runs into the rivers; when there is no snow, the rivers don’t have as much water, which lessens our water supplies.
The skill I developed during this project is analyzing graphs and data. We were given graphs and data throughout the unit, and had to analyze them for our quizzes. I think this was the most important skill we used in this project because in order to see the extent of avalanches is reading the data and understanding what that means.
Helmet Project:
Water Bottle Rocket Project:
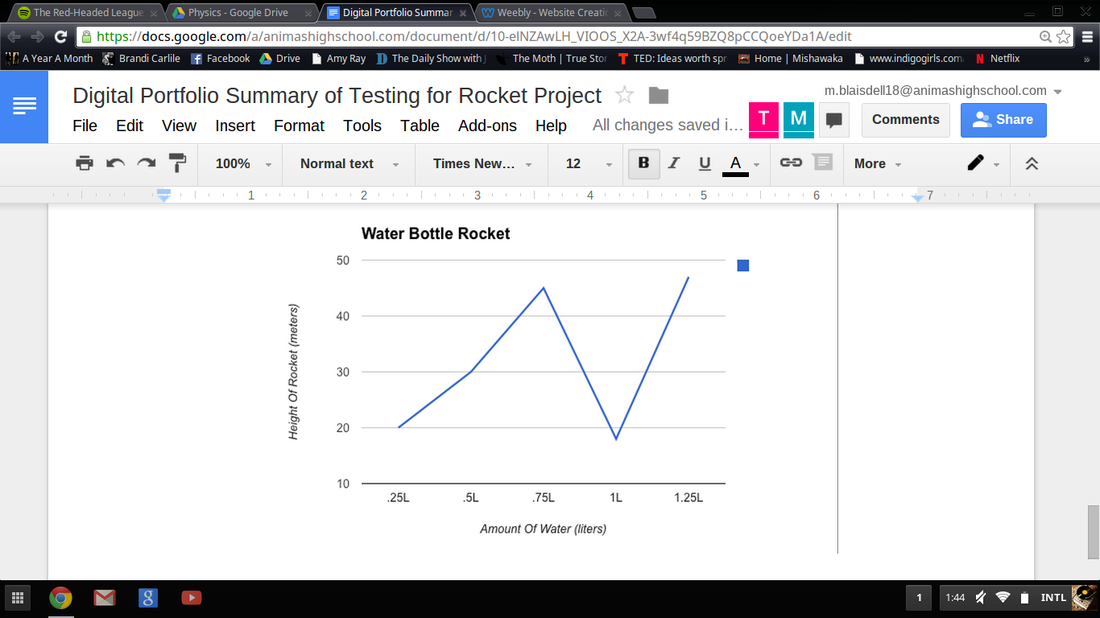
The testing variable we chose was the amount of water in the bottle because we wanted to know if it would affect the height. Our question was how does the amount of water affect the distance of the rocket? Our hypothesis was if the amount of water affects the height of the rocket, then we can find the amount of water that will make the rocket go the highest.
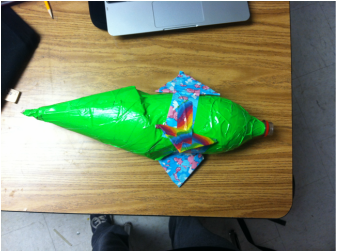
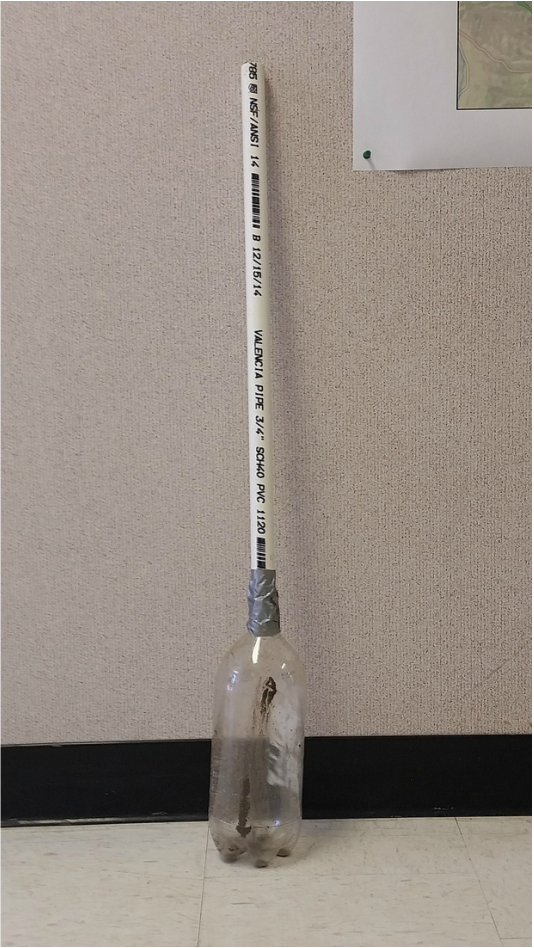
Rocket Description
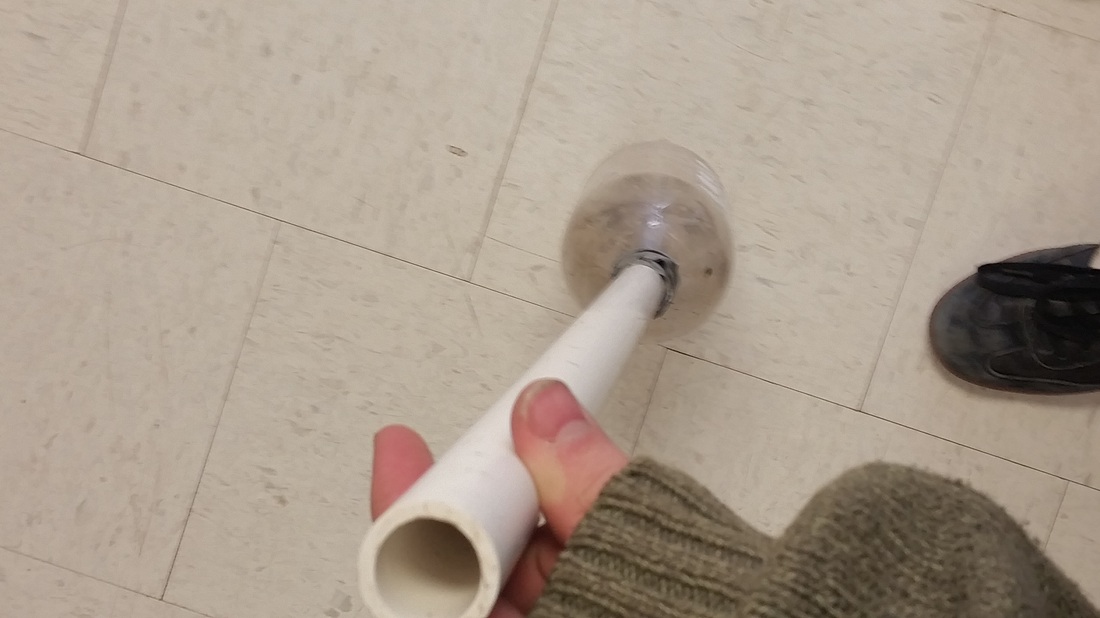
I chose to do a very simple rocket because all the materials can easily be replaced. This is important because if part of my rocket breaks, or I lose the rocket, I can still continue with the project. For the nose cone, I will use cardboard, although this is not the most durable option to use, it is easy to come by and can be easily replaced. For the fins I will also use cardboard, it will work well because it is both pliable and stiff enough.
Procedure
We added water to our rocket before going outside. Then we went out to the launch pad and had two other people help us to connect the rocket. Once it was connected we had the same two people take an angle measure and they recorded the angle that the rocket went its highest. There were also people who pulled the pins so the rocket could take off. There was also a person using a bike pump to keep the P.S.I at a certain pressure so the rocket had a constant pressure. Once the rocket came back down to the ground we collected the data that the other people collected so we could conclude our testing This is the procedure we took to test our rocket(s).
Conclusion
In relation to our hypothesis, we discovered that the rocket went the highest when we put 1500 ml of water in the bottle. The only difficulties we encountered were with one test, so we just re-did the test. When we finished testing, we knew exactly what amount of water would make our rocket go the highest. We would recommend to keep your rocket design simple. That way if gets lost or destroyed it will be easy to repair or re-create.
Data:
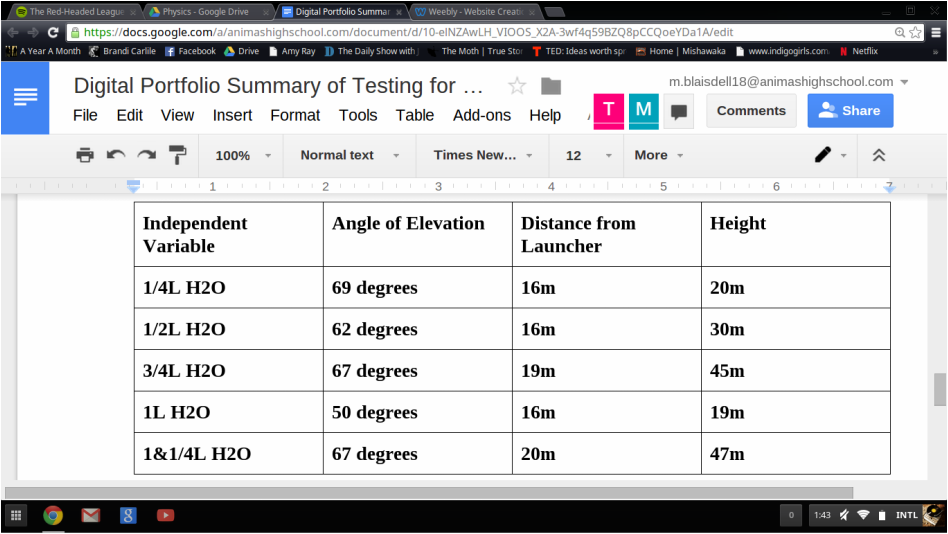
We chose to use a line graph because demonstrates our data in a clear way. We went about collecting this data by testing one amount of water at a time.